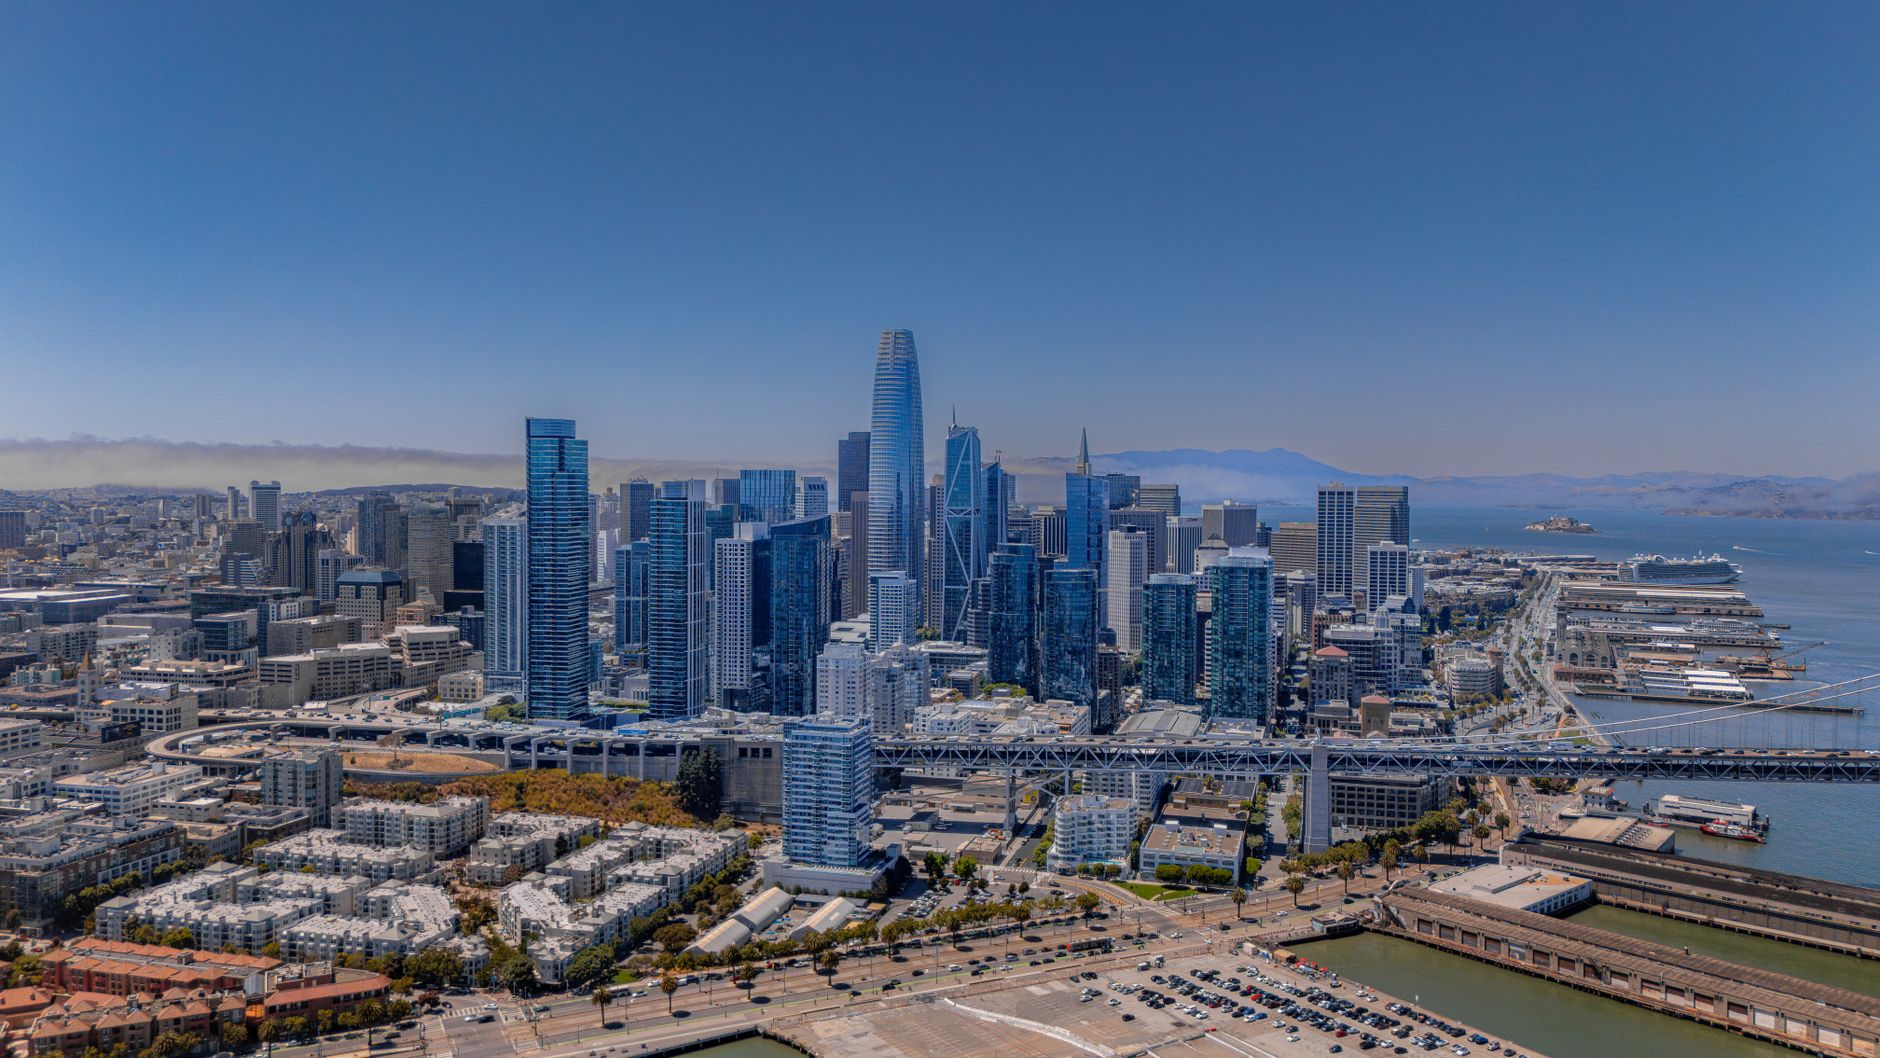
Heading out of Q3 2026, San Francisco is two markets in one city. Single-family homes closed at a $2.2M median over the trailing six months and condos at $1.299M (MLS), and those two lines move on different clocks. Read them together and you learn nothing. Read them apart and the quarter makes sense.
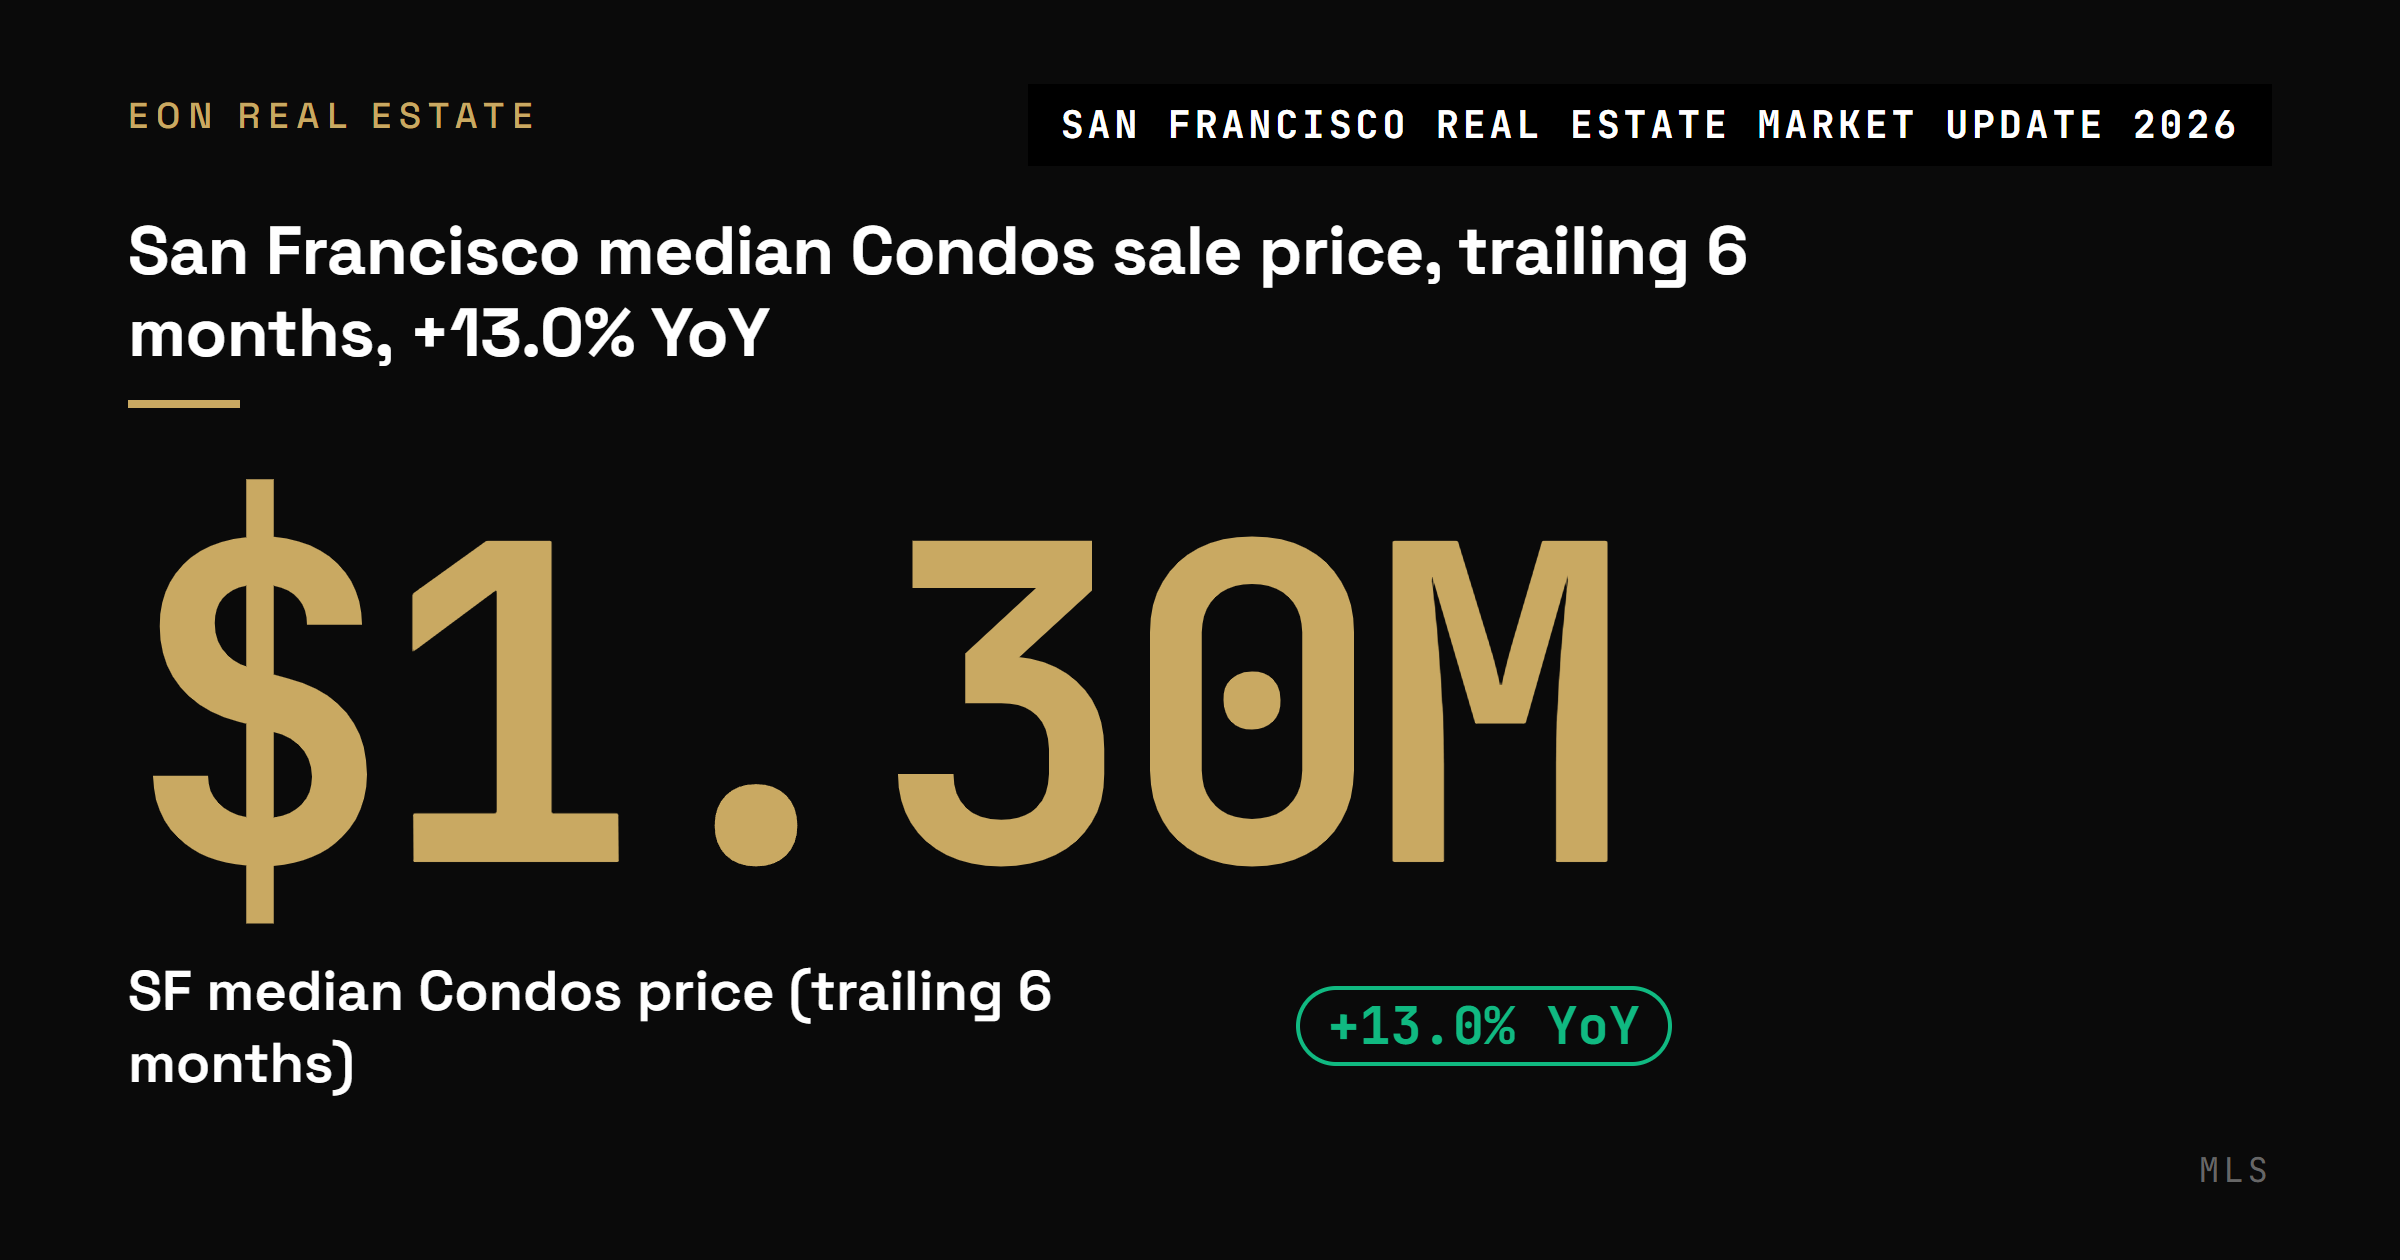
The single citywide number everyone quotes hides the real Q3 story: property type and district divergence. Over the trailing six months, single-family homes ran a $2.2M median while condos sat at $1.299M (MLS), and the gap between the top and bottom districts is wider still. District 7, covering Pacific Heights and the Marina, closed single-family homes at a $7.13M median; District 10, out toward the southern edge of the city, closed its most active type near $1.3M (MLS). A recap that gives you one price for a housing market this internally divided is telling you almost nothing useful.
The through-line this quarter is the segment split. Single-family demand never softened the way condos did after 2020, and the condo market, especially downtown and SoMa, has been firming again on return-to-office and AI-driven hiring (The San Francisco Standard). I read the two segments separately on every valuation, and the Q3 numbers are why.
Q3 2026 by the numbers
The headline figures below are per property type and stamped to their window. A blended "SF median" mixes a single-family home with a studio condo and a four-unit building, so it is the one number I never put in front of a client.
Over the trailing six months the city logged 2,613 closings at a $1.7M blended median and a 30-day average on market (MLS). The last 30 days ran slightly hotter: a $1.765M median, 28 days on market, and $1,201 per square foot (MLS). The year-over-year moves are the period-over-period story here, and they are not uniform. Single-family and duplexes are up around 27%, condos and TICs closer to 13% to 14% (MLS). That spread is the quarter in one sentence.
District-by-district: all 10 San Francisco MLS districts
This is the district-level view the headline numbers hide. Below is each of the city's 10 MLS districts over the trailing six months, with the most active property type and the standout (busiest) neighborhood inside it (MLS).
District 1: Richmond, Lake, Sea Cliff
District 1 closed 229 sales at a $2.185M median and 23 days on market over the trailing six months (MLS). Single-family led with 98 closings at a $2.6425M median and just 15 days on market. Central Richmond was the busiest pocket, with 66 closings at a $2.075M median (MLS).
District 2: The Sunset and Parkside
District 2 is the city's single-family engine. It closed 222 sales over the trailing six months at a $1.91M median and a brisk 19 days on market, with 171 of those single-family homes at a $2.025M median (MLS). Central Sunset stood out at 57 closings and a $2M median.
District 3: Ingleside and the far southwest
District 3 is the most approachable western district: 83 closings at a $1.5M median over the trailing six months, led by 66 single-family homes at a $1.6M median (MLS). Ingleside Heights was the standout with 21 closings, though at 48 days on market it moved slower than the city average.
District 4: Twin Peaks west and St. Francis Wood
District 4 posted a $2.35M overall median across 163 closings over the trailing six months, with single-family the dominant type at 134 sales and a $2.605M median (MLS). Diamond Heights was the busiest neighborhood at 26 closings, but its activity skewed to condos at a $657,500 median and a long 98 days on market.
District 5: Noe Valley, the Castro, Haight
District 5 was the second-busiest district with 418 closings and a $2M median over the trailing six months (MLS). Condos led by count at 164 sales and a $1.5275M median, but the number I watch is Noe Valley single-family: 53 closings at a $3.35M median and only 11 days on market. See the Noe Valley market update for the block-level read.
District 6: Hayes Valley and the central corridor
District 6 closed 168 sales at a $1.65M median over the trailing six months, and it is condo-led: 95 condo closings at a $1.55M median and 21 days on market (MLS). Hayes Valley was the standout at 48 closings and a $1,400,069 median.
District 7: Pacific Heights, Marina, Cow Hollow
District 7 is the luxury top of the city: a $2.96M overall median across 224 closings over the trailing six months (MLS). Single-family here closed at a $7.13M median across 45 sales. By count, condos led with 122 closings at a $1.7025M median, and Pacific Heights was the busiest neighborhood at 128 closings.
District 8: Nob Hill, Russian Hill, downtown
District 8 is condo-dominated, and it carries the longest marketing times of any district: 317 closings at a $1.35M median and 42 days on market over the trailing six months (MLS). Condos led with 199 sales at a $1.08M median. Nob Hill was the standout at 89 closings and a $1.58M median.
District 9: SoMa, Mission, South Beach
District 9 was the busiest district in the city with 587 closings over the trailing six months at a $1.345M median (MLS). It is overwhelmingly condo: 422 condo closings at a $1.1M median, though at 46 days on market. South Beach alone logged 138 condo closings at a $1.2575M median.
District 10: Bayview, Excelsior, the southeast
District 10 is the city's value district: 202 closings at a $1.229M median and the lowest price per square foot in town at $833 over the trailing six months (MLS). Single-family led with 171 closings at a $1.3M median. Excelsior was the standout at 38 closings, a $1.325M median, and a quick 17 days on market.
What's driving the numbers
Two forces frame Q3 2026. The first is rates. The 30-year fixed averaged 7.03% the week of 9/24/2026 (Freddie Mac), with the 15-year at 6.42%. That is the headwind on monthly payments, and it is why the condo segment, which depends more on financed buyers, lagged single-family for years.
The second is the condo recovery. After leading the city's declines starting in 2020 and falling well below their 2022 peak, San Francisco condos, especially downtown and SoMa, have been firming through 2025 and 2026 on return-to-office and AI-driven demand (The San Francisco Standard). The trailing-six-month data backs that up: condos are up 13% year over year (MLS). The recovery is real, but condos still trade below their 2022 peak, so I do not price them as if the old highs are back.
Single-family tells the opposite story. It never corrected the way condos did, and at 27.5% year-over-year growth with a 19-day average on market, it is the segment with the least give for buyers (MLS). For anyone weighing the two, you can read the buying a condo in San Francisco guide for how the segments actually compare at an offer table.
What to consider before you buy or sell this quarter
The citywide averages are a starting point, not an answer. A few tradeoffs decide the real number at your table.
Segment before you price
A $1.7M "SF median" is meaningless for your home. Single-family at a $2.2M median and condos at $1.299M are different markets (MLS). Price to your type, your district, and the last 30 to 90 days of comparable closings, not to the headline.
Days on market vary by district
The city averaged 28 days on market in the last 30 days, but District 2 single-family moved in 15 days while District 8 condos took 42 (MLS). A pricing plan built on the citywide average will misfire in both directions depending on where you sit.
The offer depends on the levers, not a formula
Financed versus cash, how many offers are in, vacant versus tenant-occupied, turnkey versus needs-work, parking and outdoor space: these decide the gap between list and close more than any single comp. I build every offer and every list price around those levers.
What to watch in Q4 2026
A few things will shape the fourth quarter. Rates are the big one: at 7.03% the 30-year fixed (Freddie Mac) has room to move in either direction around the Fed's late-year meetings, and condo demand is the most rate-sensitive segment, so any easing would show up there first. Seasonally, inventory thins into the holidays, which tends to favor sellers of well-priced single-family homes and can stall slower condo listings further. I will be watching whether the condo recovery holds its 13% year-over-year pace (MLS) or cools as the easy comparisons run out. None of this is predictable to the dollar, so the right move is to plan for a range, not a forecast. If current patterns hold, expect the single-family and condo lines to keep diverging rather than converging.
Will the housing bubble burst in 2026?
As of Q3 2026, San Francisco's data does not look like a bubble about to pop. Single-family medians are up 27.5% and condos up 13% year over year, with the citywide median holding at $1.765M over the last 30 days and homes closing in 28 days (MLS). A bubble shows surging supply and stretched days on market. The city is showing the opposite: steady demand and quick sales, with condos still priced below their 2022 peak.
Are SF home prices dropping?
No, as of Q3 2026 San Francisco prices are rising, not dropping. Over the trailing six months single-family homes closed at a $2.2M median (up 27.5% year over year) and condos at $1.299M (up 13%), and the last 30 days ran at a $1.765M citywide median (MLS). The one caveat is segment: condos are climbing but still sit below their 2022 peak, so some owners who bought at the top may still see a paper gap.
Should I sell my house in 2026 or 2027?
As of Q3 2026, the timing case rests on your segment, not the calendar. Single-family homes are up 27.5% year over year and selling in a 19-day average, which is a strong seller's setup right now (MLS). Condos are recovering but below their 2022 peak, so a condo owner who can wait may see more. I would not sell on a guess about rates; I would sell when your district and property type are strong, and single-family is strong today.
Why are people moving out of SF?
In 2026, San Francisco sales data measures closings and prices, not the reasons anyone leaves, so this update keeps to what the numbers show rather than assign motives the data cannot support. What the trailing-six-month figures do show is demand returning, not fleeing: 2,613 closings, single-family up 27.5% and condos up 13% year over year, with downtown and SoMa condos firming on return-to-office and AI hiring (The San Francisco Standard, MLS).
What is the #1 state people are moving out of?
As of 2026, that question sits outside what San Francisco sales data can answer, so this update does not attach a number to it. Interstate migration is not something our MLS figures track; they measure closings, prices, and days on market inside the city. What the local data shows is that buyer demand is active, with 361 closings in the last 30 days at a $1.765M median and a 28-day average on market (MLS).
Talk to me about your San Francisco numbers
If you want the comp set broken down by your specific district and property type, not the citywide blend, I can pull the sub-district data behind this update for your block. Whether you are weighing a sale this quarter or just want to know where your home sits against the last 30 days of closings, start with a home valuation or reach out through the contact page. You can also see how the districts rank against each other in San Francisco's richest neighborhoods.